Why viewers stop watching your YouTube videos (and how to fix it)
Your last video died and you don't know why.
The title was good. The thumbnail was fine. You even frontloaded the intro like everyone told you to. And still, half your viewers were gone before the first minute ended.
Here's the part nobody tells you: YouTube already gave you the answer. It's sitting in your retention graph, and once you know how to read it, that graph will tell you where viewers left, why they left, and how to stop it happening in the next video.
That's this post, start to finish:
- How to read a retention curve in about 60 seconds
- The five drop-off shapes, and how to tell which one is killing your videos
- Where the fix actually lives (probably not where you think)
- The fix for each shape, with examples
- What a "good" retention number really is for your video length
I read these graphs every week for my own channel. The patterns repeat so reliably it almost feels like cheating.
First, stop blaming the algorithm
When views crater, every creator has the same thought. The algorithm changed. My channel got flagged. YouTube stopped pushing me.
I get it. From the outside, it really does look like a switch got flipped.
But the algorithm is mostly a mirror. YouTube distributes videos that hold viewers, and it pulls back on videos that don't. When your views drop, the honest question is almost never "what did the algorithm do?" It's "where are people leaving, and what made them leave?"
Retention is the input. Distribution is the output. Fix the input and the algorithm becomes weirdly cooperative.
And the input is measurable. Both of those questions, where and why, have answers sitting in one graph you probably haven't been taught to read.
How to read your retention graph in 60 seconds
Open YouTube Studio, pick a video, go to the Engagement tab, and look at the audience retention graph. Three things matter.
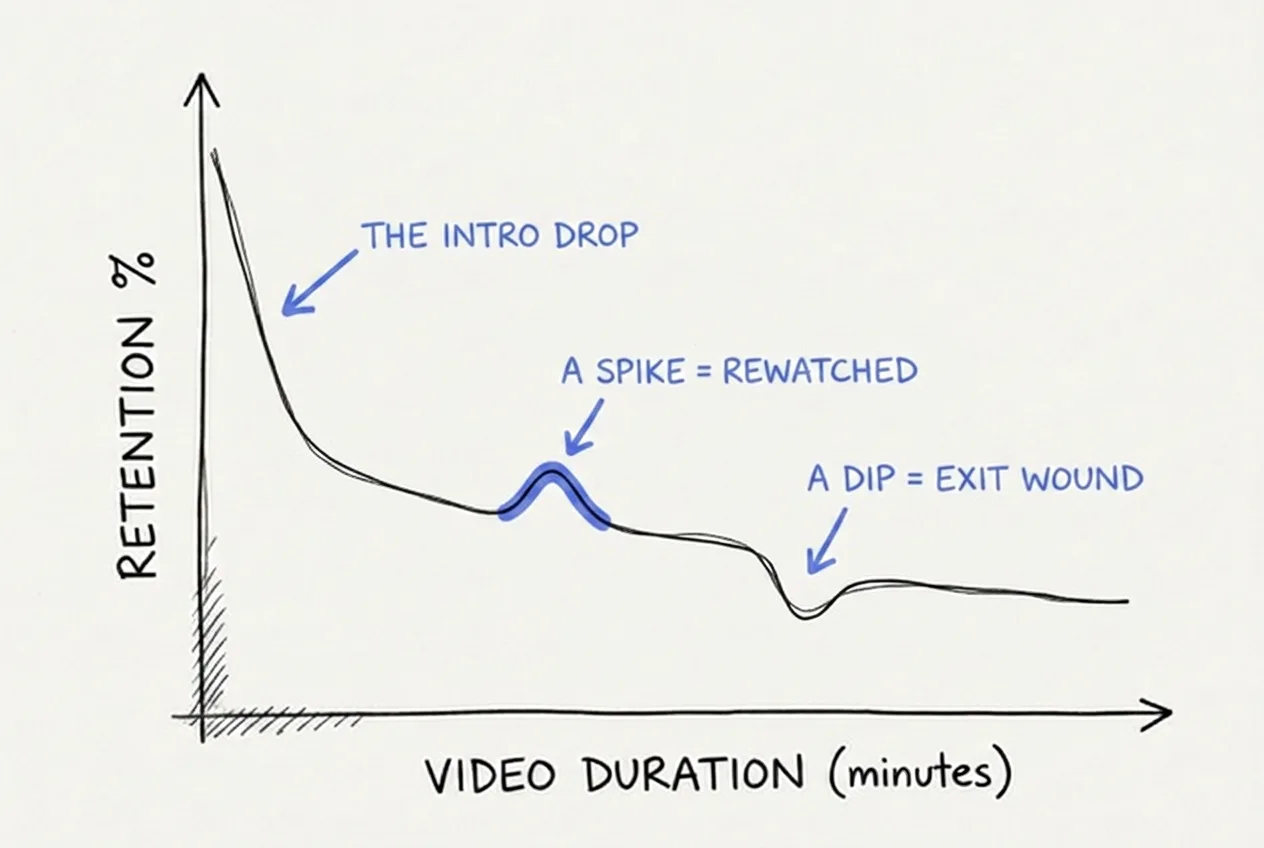
The three features worth reading: the intro drop, spikes, and dips.
The intro drop. Every video loses people at the start. Even great ones. What matters is how steep the fall is and where it levels off.
Spikes. A bump means people rewatched that moment or skipped to it. Something there was worth seeing twice. Study your spikes; they're free lessons in what your audience actually wants.
Dips. A dip is an exit wound. Something at that timestamp made a group of people quit at once. Match the timestamp to what was happening in the video and you've found a cause.
That's the reading skill. Here's the good news that makes it useful: after enough graphs, you notice the same handful of patterns showing up again and again. There are really only five, and your underperforming video is almost certainly one of them.
The five drop-off shapes
Find yours. For each shape: what it looks like, what it means, and the kinds of things that cause it. The fixes come right after, once we've settled where fixing actually happens.
1. The 30-second cliff
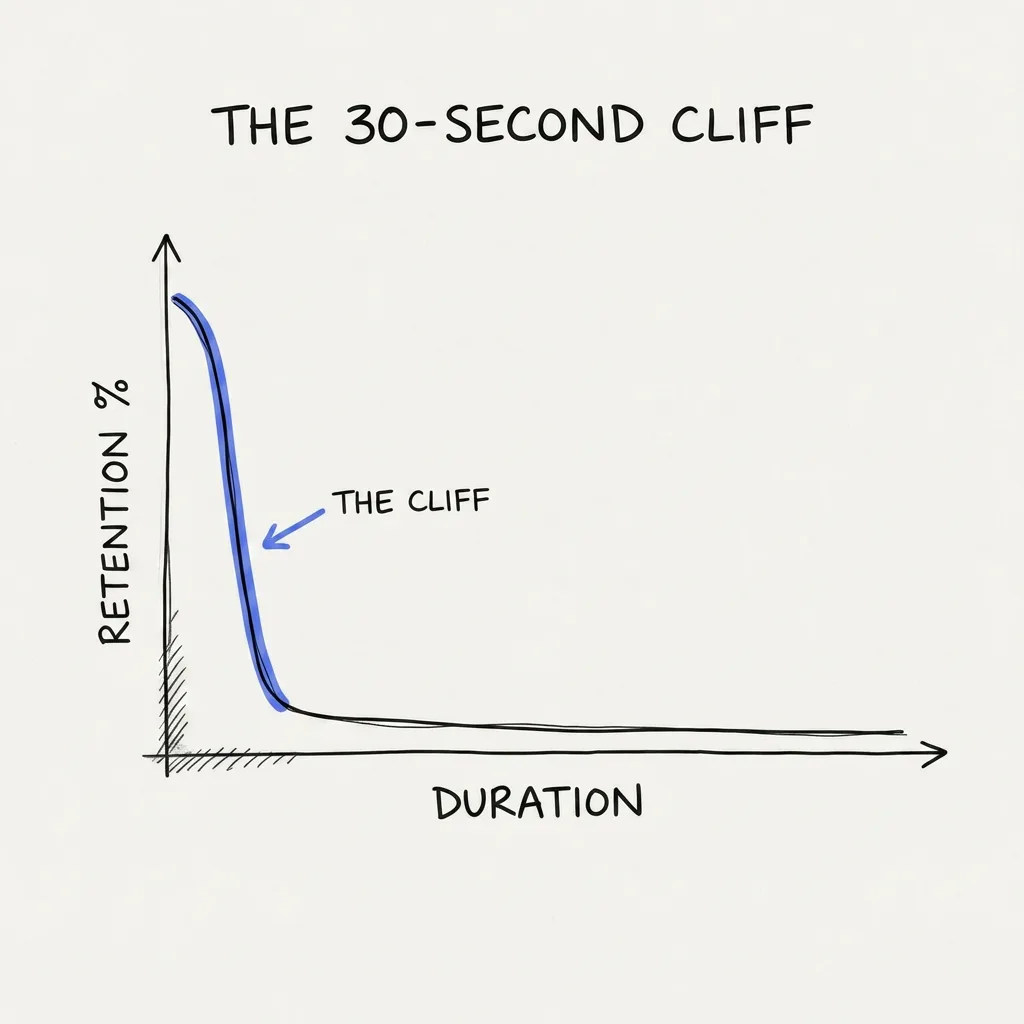
What it looks like: retention falls off a cliff in the first 30 seconds and settles low, sometimes under 50%.
What it means: your video broke the promise your title and thumbnail made. Viewers clicked for one thing, the opening seconds gave them something else, and they bounced.
What causes it, concretely:
- Openings like "hey guys, welcome back to the channel, before we start make sure to subscribe." Fifteen seconds of nothing the viewer clicked for.
- A title that asks "Can you really learn guitar in 20 minutes a day?" while the video opens with your history as a musician. Related, but not the promise.
- Long branded intro animations. Five seconds of logo is five seconds of leaving time.
- Context ramps: "so a bit of background before we get into it." The viewer didn't click for background.
2. The steady bleed
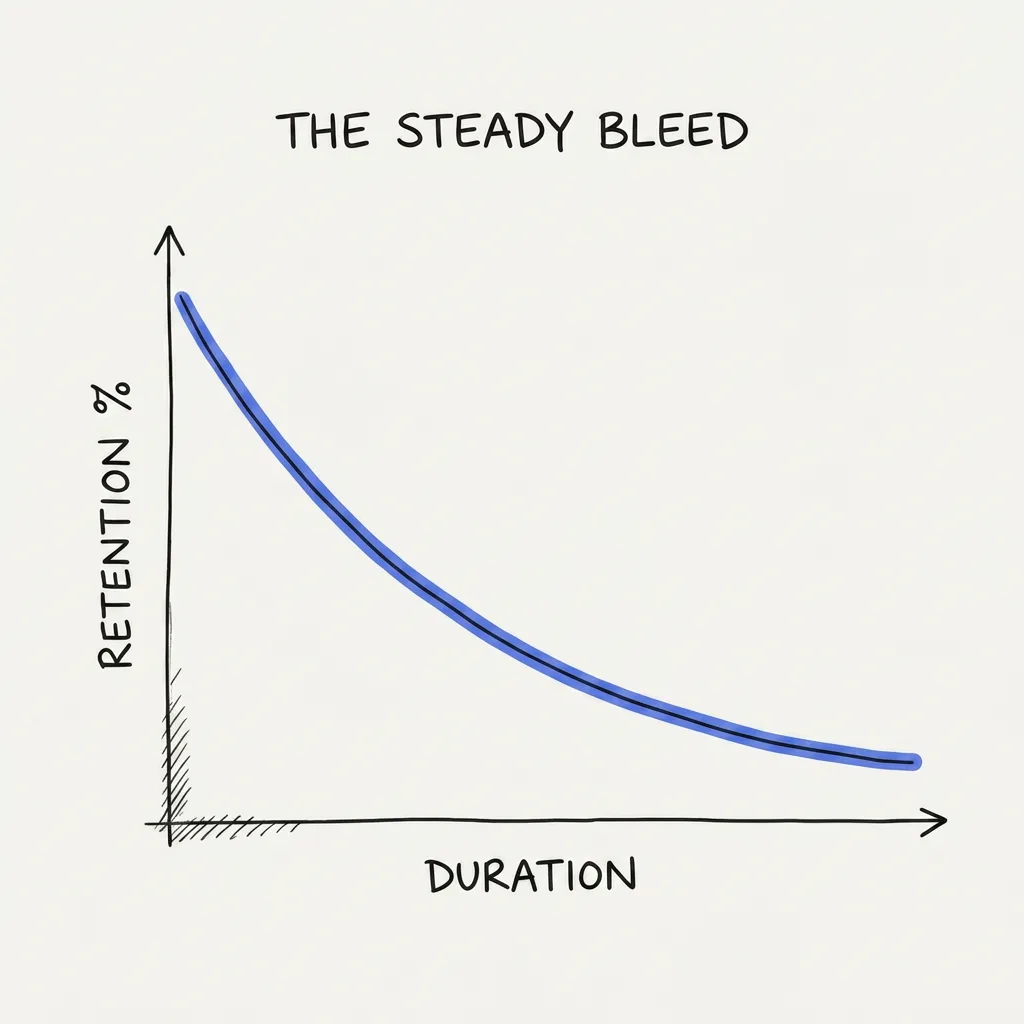
What it looks like: no single cliff, just a smooth downhill slide that never stops. By the midpoint half your audience has quietly drained away.
What it means: nothing is pulling viewers forward. Each moment answers itself and gives people a polite exit. The video is a row of closed doors.
What causes it, concretely:
- Sections that wrap up neatly: "so that's everything about lighting. Next, audio." Complete thought, natural exit.
- Delivering the entire answer in the first third, then elaborating for eight minutes.
- Lists where every item is the same size and shape, so the viewer can extrapolate the rest without watching.
3. The mid-video sag
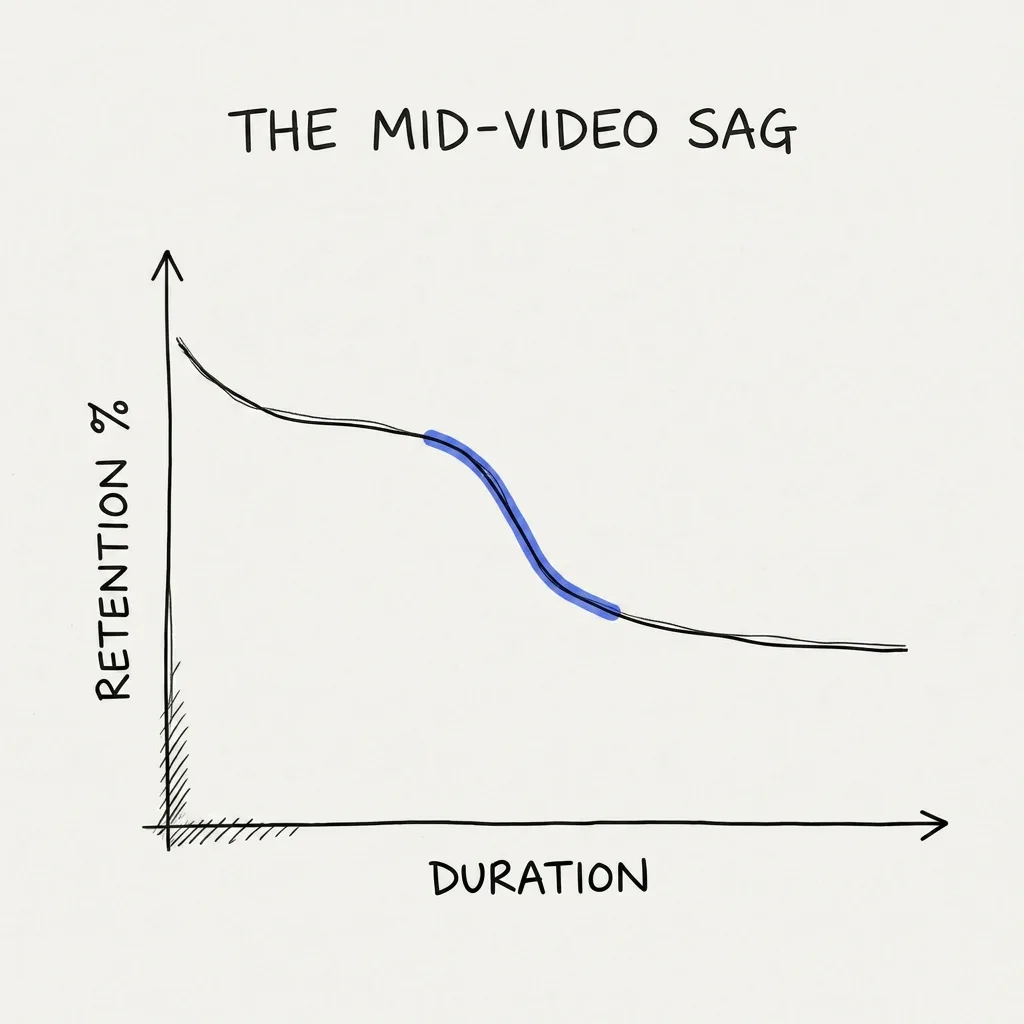
What it looks like: healthy start, then a slump somewhere between 50% and 60% of the runtime that never recovers.
What it means: your video ran out of forward pressure at exactly the point where attention naturally bottoms out. The opening promise feels either already delivered or too far away.
What causes it, concretely:
- The hook's question got answered at minute four of a ten-minute video, and everything after is bonus material the viewer didn't order.
- A long unbroken stretch of the same energy: same shot, same pace, same voice, no new question raised since the intro.
- Detours: "while we're here, let me also show you..." The viewer's goal and the video's path just diverged.
4. The late cliff
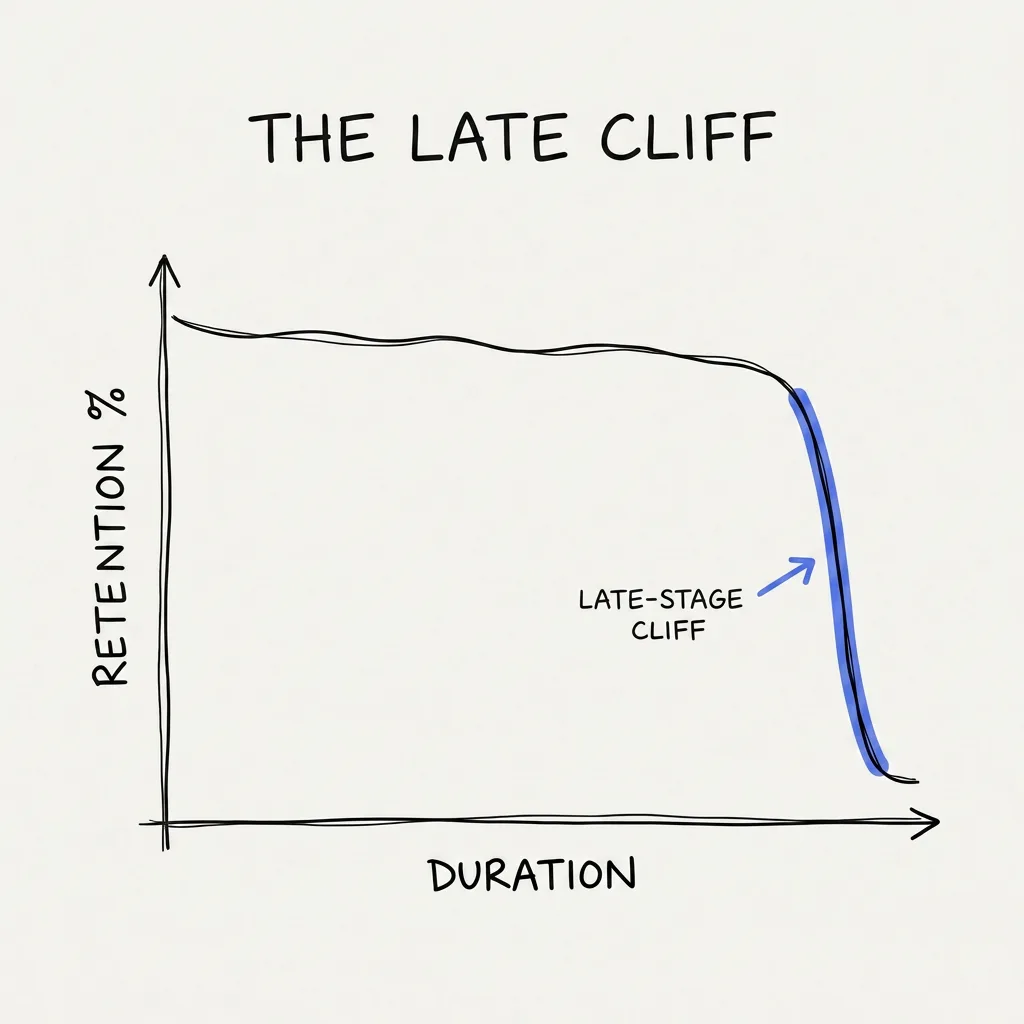
What it looks like: strong retention almost all the way, then a sheer drop in the final stretch, well before the video actually ends.
What it means: you delivered the payoff and kept talking. Viewers can smell a video winding down, and the moment the promise is fulfilled, they're done.
What causes it, concretely:
- The reveal lands at minute eight of an eleven-minute video, followed by three minutes of recap.
- Outros with five asks: like, comment, subscribe, join the Discord, watch two more videos. Each ask is another second of leaving time.
- "So yeah, that's pretty much it" delivered ninety seconds before the video ends.
5. The sawtooth
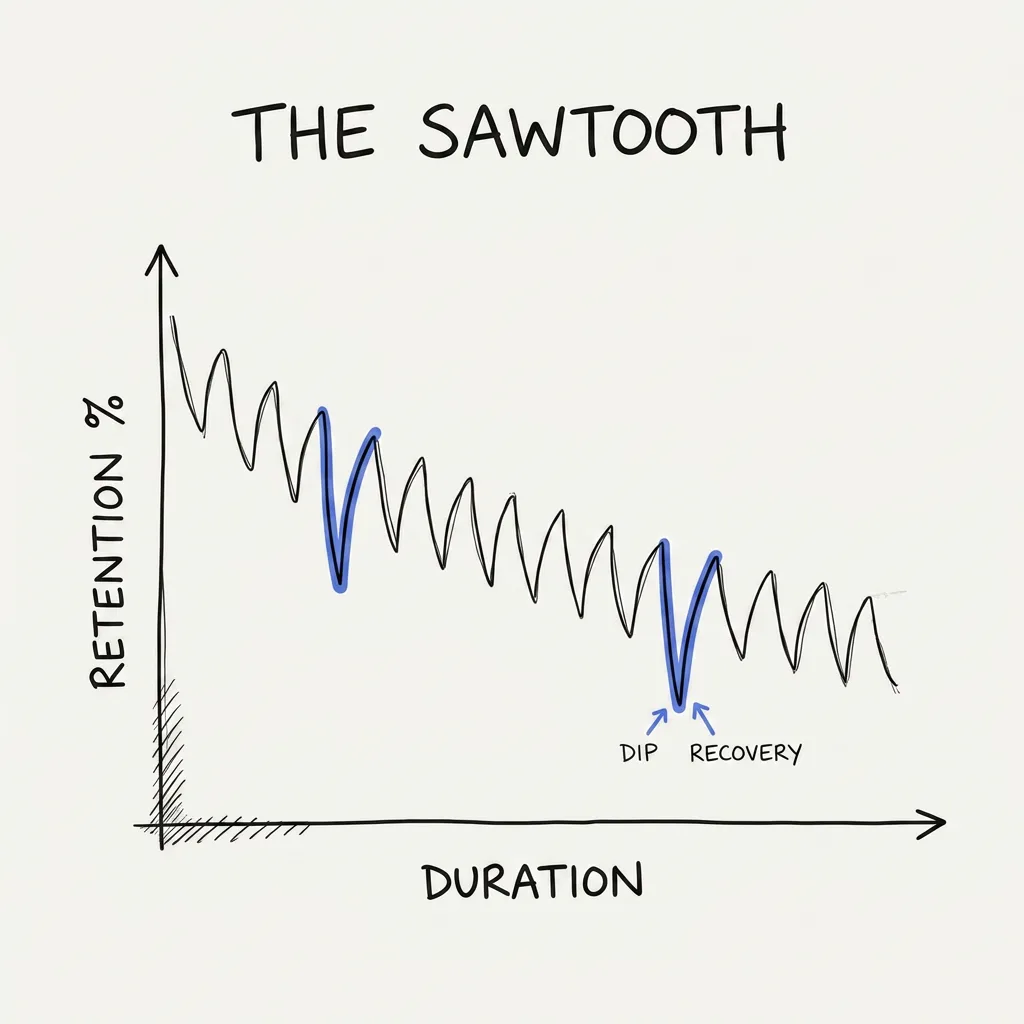
What it looks like: a dip at the start of every section, a partial recovery, another dip. Teeth on a saw.
What it means: each section of your video front-loads its own conclusion. Viewers skip or leave at every reveal, then the curious ones settle back in. Your video-level structure might be fine; the sections themselves have no internal pull.
What causes it, concretely:
- Section openers that give away the section: "Tip three: batch your filming. Batching means..." Everyone who got the idea from the first sentence skips ahead.
- Chapter titles that spoil their own content, turning the video into a menu people order one bite from.
- Explaining backwards: conclusion first, reasoning after, in every single segment.
Okay, you've found your shape. Where do you fix it?
Here's where most advice goes wrong, so let's slow down for a second.
A creator staring at a bad retention graph has a menu of things they could improve: better camera, tighter editing, punchier thumbnails, faster pacing, more b-roll. All real levers. So why am I about to tell you the fix lives in your script?
Run through the menu honestly. Gear changes how your video looks, and viewers demonstrably forgive plain-looking videos; they don't forgive boring ones. Thumbnails and titles change who clicks; they can't hold anyone past the click. Editing can disguise a drop-off point, cut a ramble, add motion at a sag, but it's treating symptoms: an edit can hide the moment viewers got bored, not the reason they got bored. Every cause on the list above, broken promises, closed doors, answered questions, spoiled reveals, is a decision about what gets said and in what order.
Decisions about what gets said and in what order have a name. That's a script.
"But I don't script my videos." You still have one. If you talk from bullet points, your script is improvised; if you just hit record, your script is whatever order your thoughts came out that day. The question isn't whether you have a script. It's whether anyone designed it.
The script is where retention is decided; everything else polishes what it decided. It's also the cheapest place to intervene: changing a sentence costs nothing; reshooting and re-editing cost your weekend. If you've never designed one deliberately, start with how to write a YouTube script from scratch.
So: the fixes, shape by shape.
The fixes, shape by shape
The 30-second cliff → confirm the click, immediately. Your first two sentences must sharpen the title's promise, not detour from it. If the title asks a question, the hook commits to answering it. Before: "Hey guys, welcome back! Today we're talking about guitar practice." After: "Twenty minutes a day beat my two years of weekend practice. Here's the exact routine." No greeting, no logo, no background. You're mid-conversation from word one. (I've dissected six real openings in these hook examples.)
The steady bleed → end every section with an open door. A question you haven't answered, a result you haven't shown, a turn: "which worked perfectly, until day nine." Before: "So that's everything about lighting. Next, audio." After: "And once the lighting looked right, it exposed a problem I didn't expect to have: my audio was lying to me." Same content, but now the section ends by opening the next. Scriptwriters call these open loops, and they have a whole placement system.
The mid-video sag → plan a beat at the halfway mark. On paper, before you write anything else. Close an early question and immediately open a new one, drop a reframe ("everything I just showed you has one flaw"), or talk straight to the viewer ("if you're still here, this next part is why you stayed"). It should feel like a reward and a fresh reason to continue, at the same time.
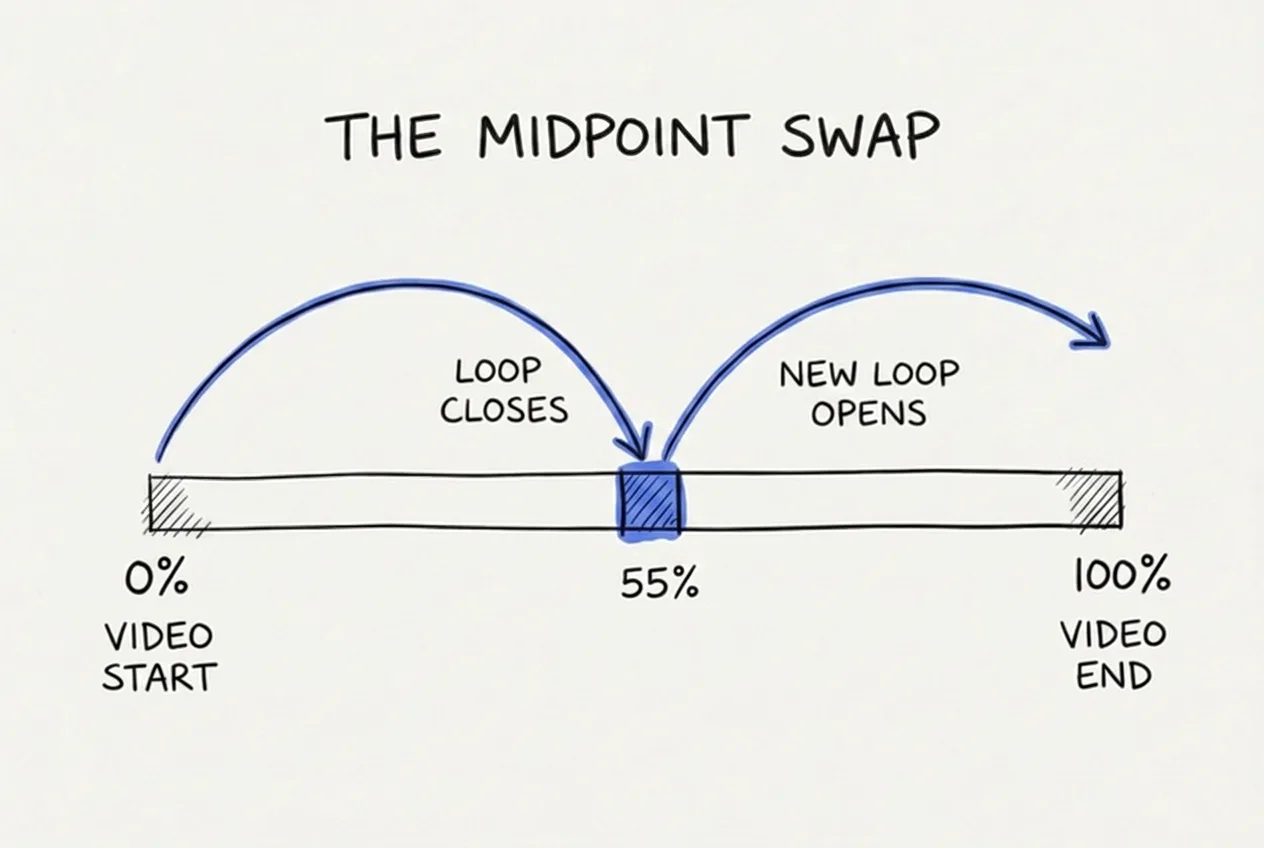
The sag fix: a planned beat at 50 to 60% that closes one question and opens another.
The late cliff → hold your best payoff, then end fast. Keep the biggest reveal in the final third, and after it, land one memorable line and one ask. Before: reveal at minute eight, recap until eleven, five asks. After: reveal at minute nine and a half, one sentence that sums up the video, one ask, under thirty seconds, done.
The sawtooth → make every section a tiny story. Open each section on something unresolved, build the complication, land the point at the end, never the top. Before: "Tip three: batch your filming. Batching means..." After: "Tip three is the one that actually got me my Sundays back, and it sounds like it shouldn't work." The gap between a claim and its proof is what keeps people watching. This per-section arc is the deepest layer of how I structure videos, and it's the one that changed my scripts the most.
Once you're fixing: what's a good retention number, actually?
The moment you start working on retention, a new question appears: what number should I even be aiming for? Here's the answer you'll hate: it depends on length.
The folk wisdom floating around creator communities says "keep 50% or you're failing," and it's useless without context. One answer I've seen in r/NewTubers put it well: 50% retention on a ten-second Short is bad, and 50% on a fifty-minute video is exceptional.
Rough bands I trust for long-form educational videos in the 8 to 20 minute range, based on community-reported numbers and my own channel:
- Under 30% average view percentage: the script has a structural problem. Find your shape above.
- 30 to 45%: normal for small channels. Fixable with hook and loop work.
- 45 to 60%: solid. The algorithm usually starts cooperating here.
- Over 60%: excellent. Your problem is packaging or topic selection, not the script.
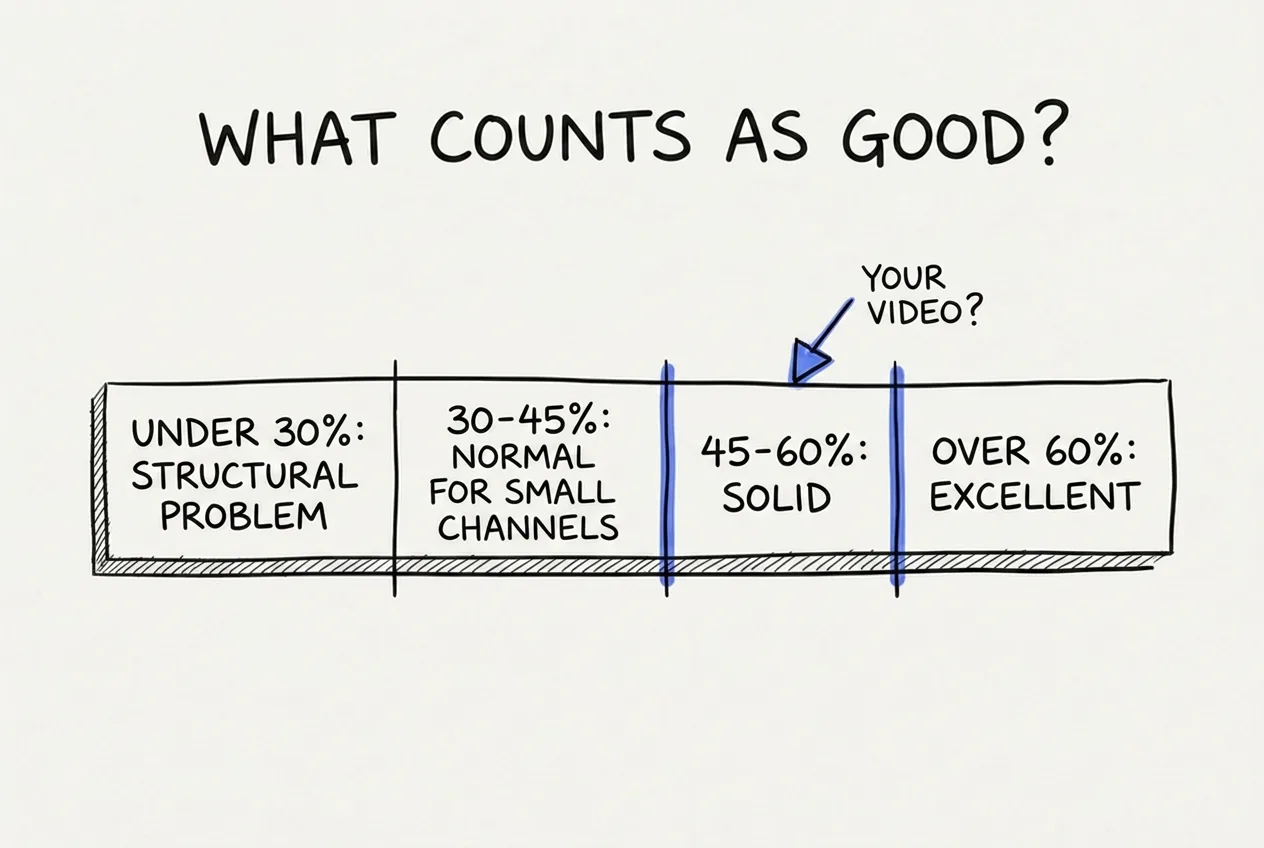
What counts as good, at a glance. Find your video on the gauge before you compare against anyone else's numbers.
Two caveats. Longer videos naturally sit lower, so judge an 18-minute video more gently than a 9-minute one. And your own baseline beats any benchmark: a video that holds 5 points above your channel average is a win even if the absolute number looks modest.
Compare videos against your own baseline first, the internet's numbers second.
The whole diagnostic, on one imaginary channel
Let's run everything on a hypothetical, because it's easier to see the method on someone else's graph. Meet a made-up creator: a woodworking channel, 900 subscribers, 12-minute build videos, stuck at 32% average view percentage.
Their latest graph shows a healthy intro, then a long smooth slide from minute two onward. No single cliff. That's shape two, the steady bleed. Matching timestamps to the video, each build stage wraps up completely before the next begins: "so that's the legs done. Now the tabletop." Closed door after closed door.
The fix costs nothing to film. In the next script, every stage ends by opening the next: "the legs were done, but I'd made a measurement mistake that wouldn't show up until the tabletop." Same build, same footage style, same editing. Three videos later, the slide flattens out and average view percentage sits at 41%. Not magic. Doors.
That's the entire method: read the graph, name the shape, match the timestamp to the cause, fix it in the script, compare against your own baseline.
The 7-step plan
If you're now wondering where to actually start, here's the whole post as a checklist. You don't need to re-learn scriptwriting this week; you need to run the diagnostic once.
- Open the retention graphs for your last three videos.
- Identify each video's shape from the five above.
- Match every major dip to the exact moment in the video that caused it. Write the cause down.
- Re-script your next video's opening until it confirms the click in two sentences.
- End every section of that script with something unresolved.
- Place one re-engagement beat at the halfway mark.
- After the payoff, cut everything except one ask.
That's a full diagnostic cycle. Most creators never do it once.
The honest part: you have to keep doing this
One diagnostic cycle will genuinely improve your next video. But that's not how retention compounds. The creators who win at this run the cycle on every video, for months: every script structured around the beats, every section ending on an open door, every payoff held to the final third, checked against last video's graph.
And that's the hard part, for reasons you can probably already feel:
- The diagnostic takes discipline to repeat when a video flops and motivation is low.
- Holding hook contract, open loops, midpoint beat, and payoff order in your head while writing is a lot of simultaneous bookkeeping.
- Rewriting one section without unraveling the others is tedious in a doc.
- And most part-time creators barely have the hours to write one script, let alone iterate on it.
That's why I built ScriptGraph. It structures every script around these exact beats by default: typed sections for hook, re-engagement, and payoff, open loops planted and closed as real objects in the outline, and ready-made alternative takes for every section, so rewriting is picking, not unraveling. The diagnostic stops being discipline and becomes the default shape of every script you write.
This is ScriptGraph building the structure from this post automatically. The loop badges are the open doors from shape two.
If your last graph looked like any of the five shapes, and you're looking for a way to fix it, check out ScriptGraph. The free tier lets you build full scripts manually forever, so worst case you leave with a better outline.
Quick answers
What is a good audience retention rate on YouTube? It depends heavily on video length, so any single number is misleading. For long-form educational videos in the 8 to 20 minute range, under 30% average view percentage usually points to a structural problem, 30 to 45% is normal for smaller channels, 45 to 60% is solid, and over 60% is excellent. Longer videos naturally sit lower, so judge an 18-minute video more gently than a 9-minute one. The most useful benchmark is your own channel average rather than the internet's numbers, since a video that holds a few points above your baseline is a win even if the absolute figure looks modest.
How do I read my YouTube retention graph? Open YouTube Studio, pick a video, go to the Engagement tab, and find the audience retention graph. Three features matter. The intro drop shows how steeply you lose people at the start and where the curve levels off. Spikes mark moments people rewatched or skipped to, so they tell you what your audience wanted more of, and dips are exit wounds, where you match the timestamp to whatever was happening in the video to find the cause.
May you fix your retention curves.
Adi
50%
off · life
Founding Member offer · live now
Script your next YouTube video in 30 minutes
The first 100 subscribers lock in 50% off, for life.
Adi
Founder of ScriptGraph and part-time YouTuber since 2020.
Check out my channel